“Ultimately this was a good reminder about data model design: it’s good to look past your immediate requirements and think of how people might want to use your model in the future.”
In the latest round of changes I’ve made to my previously published Power BI report that uses Mint.com data to render your personal finances in interesting ways, I’ve introduced the concept of “exceptional” transactions. In this article I explain the motivation to support this from a financial standpoint – and the technical ramifications of how it changed my approach internally. You can download the latest version from here. (If you previously were asked survey questions and are asked again: I apologize in advance! A change was made not too long ago to try and prevent getting asked multiple times, but it might not apply to everyone.) If you’re interested in the gory details of DAX changes, then the technical section hopefully reveals a couple of insights on the road of incremental improvement.
Let’s say you’ve worked hard and are rewarded with a bonus. Woo-hoo! This might be an expected event (e.g. an incentive bonus) or unexpected, but in either case it can have a positive impact on your day-to-day finances; however, it can also make reporting on your finances harder. How?
First, there are multiple ways to interpret this infusion of cash. The funds might be something you intend to integrate slowly into your spending over say the entire year, for daily expenses. In this case, you’ll see an income spike, followed by “regular spending,” which existing reporting can deal with. In fact, the Income page is set to show a line that’s your median monthly income, so spikes will not affect that as much:
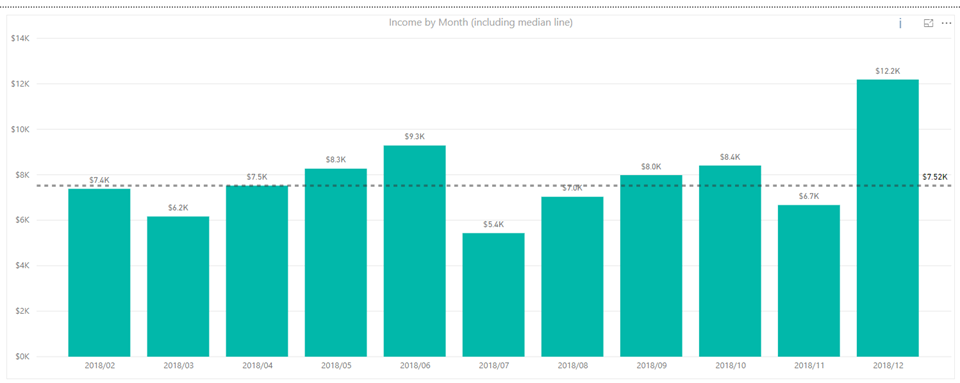
(As illustrated here, our fake family received a bonus payment of $6,000 in December 2018.)
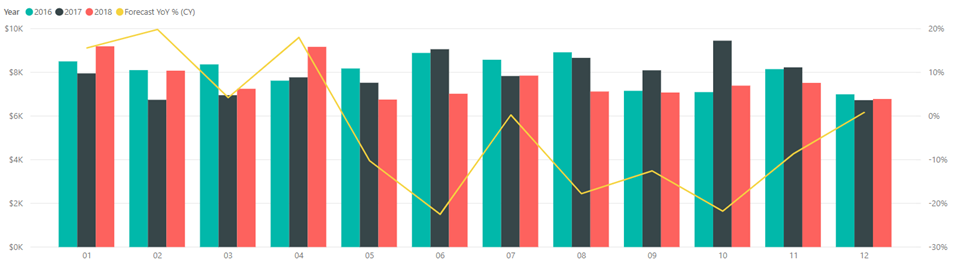
On the other hand, you might be living within the confines of your monthly income, where a bonus becomes something over-and-above: funds that you can spend on something out-of-the-ordinary. (As a suggestion from a personal finance perspective: it’s a good idea to interpret anything short of an iron-clad bonus in this manner, to keep you living within your means!) Perhaps you’ll spend it on a trip, or a down-payment for a car – but whatever it is, there’s a good chance you’ll see a burst of expense that on the surface looks bad in reports:
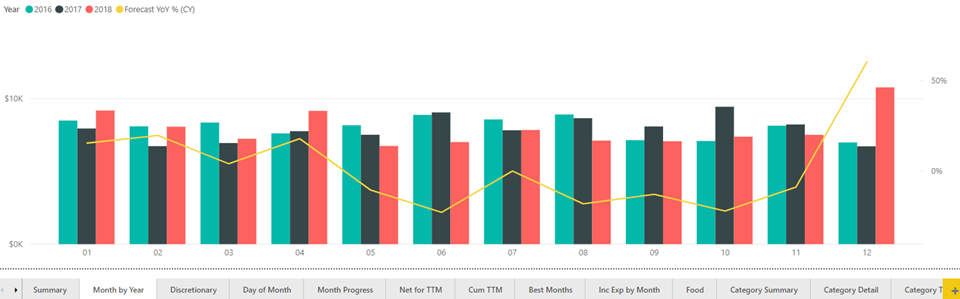
Notice in December it looks like we’ve really fallen off the wagon by spending far more than usual. We’ve blown the year-over-year percentage out of the water, and without the narrative behind it about an influx of income to support it, we’d rightfully be worried. Whether this spending was for a big purchase, or just a lot of smaller transactions, the income itself is effectively paired with expenses that are all considered exceptional. If we could flag the income and expenses as being exceptional, we could have the option to either include it (such as when looking at total net cash flow), or exclude it when trying to evaluate “how am I doing with respect to my baseline spending?”
Luckily, this is not hard to do. In Mint.com, I’ve added a tag called “Exceptional” that can be associated to any transaction I like:
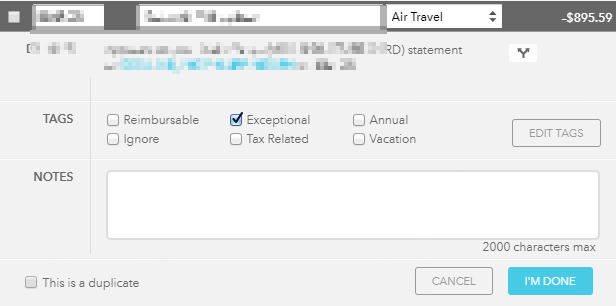
(This was added initially by clicking on “Edit Tags.”)
Now when you export transactions from Mint per the instructions I go through in my previous articles, the text “Exceptional” appears in the “Labels” column of the export file. Changes I’ve made in the .pbix report file recognize this and offer a way to filter out exceptional transactions globally. On the Summary page, I’ve added a global slicer:
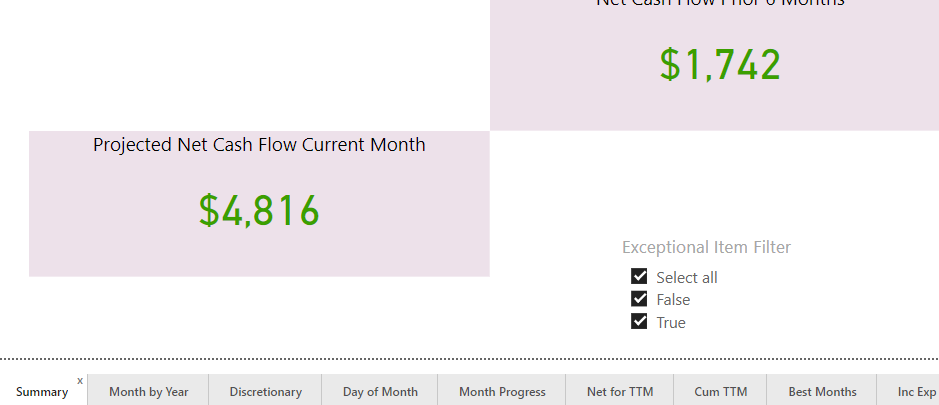
The default setting has all transactions selected, which is the prior behavior of the report. However, we can unselect “true” here to filter out exceptional items:
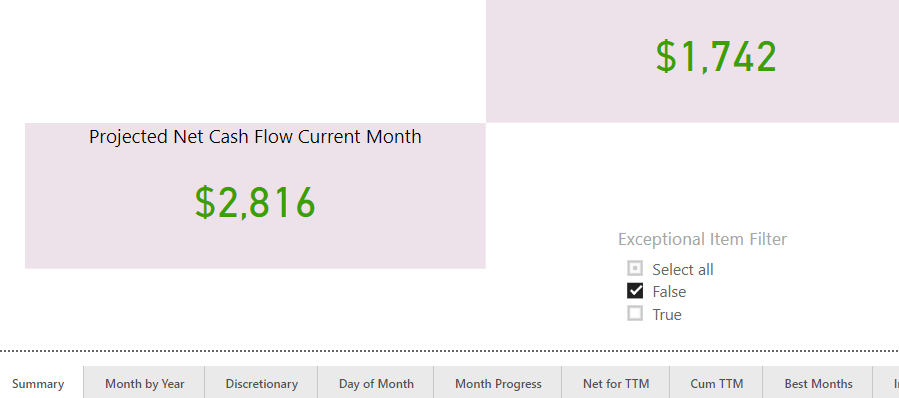
Notice in doing so, our projected net cash flow in the current month has dropped by $2,000, reflecting the fact we had $6,000 worth of “exceptional income,” plus a $4,000 transaction for a trip we paid for, also marked as an “exceptional expense.” Now our monthly view looks like this:
December’s year-over-year change now looks entirely consistent with the prior year, meaning outside of the exceptional events that have been spoken for, our spending has not been unusual. This option is a positive since human tendency can be to simply spend the bonus without focus on what it was intended for. We’d see that in this reporting as excess expenses which appear even when filtering out exceptional transactions.
Another new feature of the latest report version is a waterfall chart:

Where do these numbers come from? If we look at “Kids” as an example, we see a green bar showing $392. This represents an average savings of $392 per month on expenses in the Kids category over the last 6 months, compared to the 18 months prior to those 6 months. This could be because we’ve changed child-care arrangements, but regardless of the reason, it’s contributing to a net monthly savings when we compare the most recent 6 months against the older months. The cards on the right extend this concept further: in aggregate, our monthly savings when multiplied by 12 is about $8,093 – a good sign we’re controlling spending more effectively recently. However, the same type of analysis applied to our income shows a much less happy story: we’re falling behind on income, and the net effect (income increase plus expense savings) is still quite negative. We might have an explanation for this and hopefully a plan to address it. As with other projections here, it’s built on several assumptions that may or may not hold in all cases, so look at this as another guidepost, not a definitive reason to scream “OMG”!
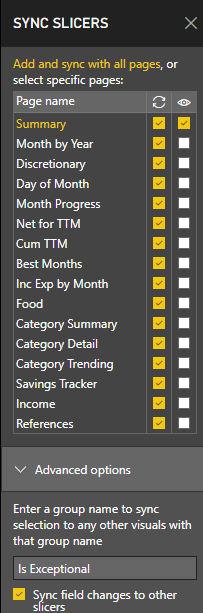
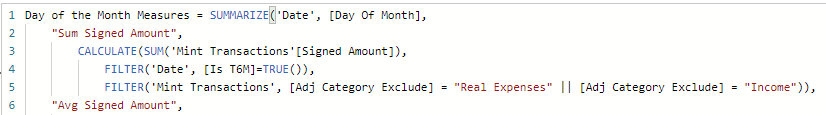
The ability to filter by “exceptional” transactions (true/false) sounds easy, yes? Technically it is but given the way I’d previously implemented the “Day of the Month Measures” calculated table, I had a problem. The calculated table used SUMMARIZE to group by the day number of the month, calculating various “by day” values to show on pages such as the “Day of Month.” However, a calculated table is static with respect to filter context. (The same being true for calculated columns.) How is filter context involved here? The slicer added to the Summary page offers filter context to all pages. Making that happen is possible using the “Sync slicers” window, which we can see by checking this:

With it visible and having selected the slicer itself, we can pick any or all pages that should be filtered by the slicer:
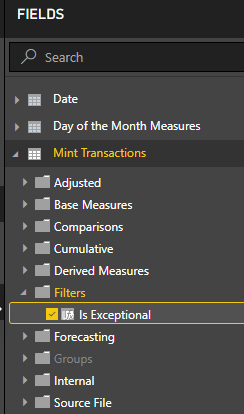
In terms of the “Is Exceptional” value, I added it as a calculated column since we can determine it, per transaction:
![]()
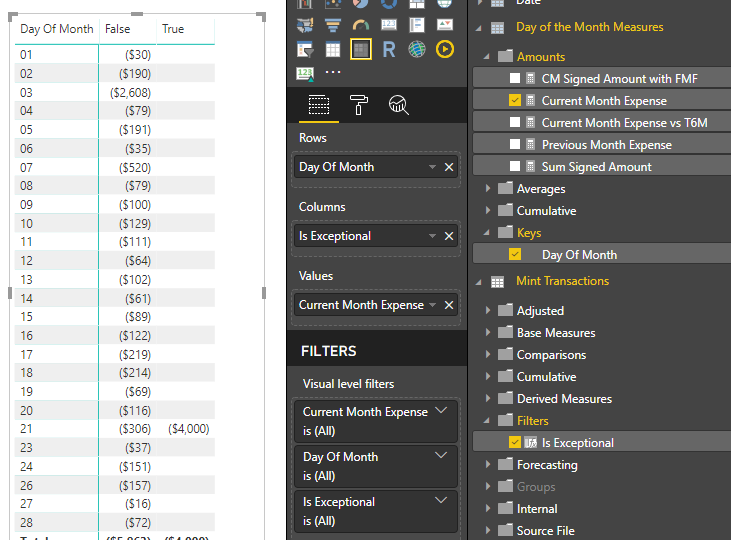
Back to the calculated table: leaving it the way it was before would have meant if we assembled a matrix visual where we have “Is Exceptional” for columns, the underlying value in the calculated table would be repeated, incorrectly (note the 1st and 21st):
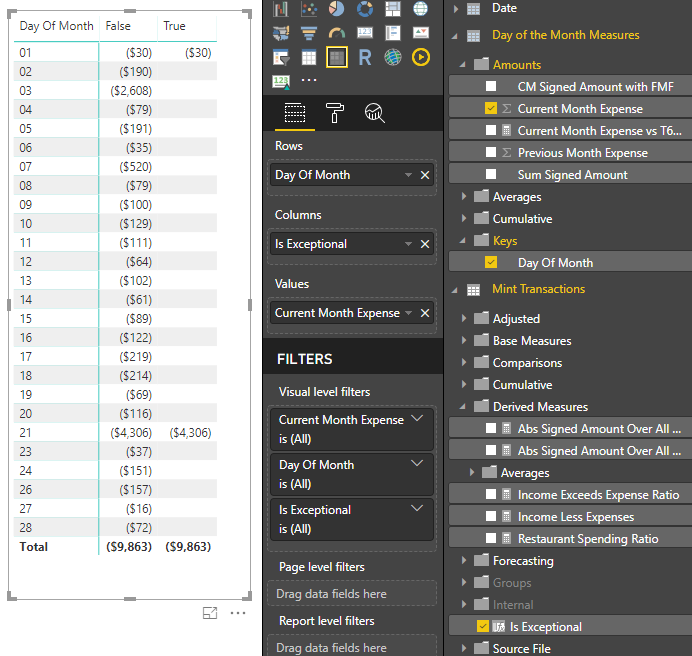
Some might say, “but it’s a calculated table, why can’t it see this grouping?” It’s affected by a core DAX concept: calculated columns and calculated tables are built at processing time, not as client tools apply their filters.
My choice of doing “Day of Month Measures” made sense in the moment initially when I had no need to apply filters by anything that wasn’t already being calculated out for the individual columns on the calculated table – but it’s more flexible to have made those into measures that can “see” client-side filters – such as the one my new global “Is Exceptional” slicer applies.
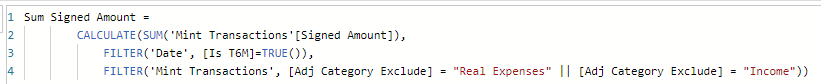
What this means in a practical sense is I changed the calculated table definition to be much, much simpler:
Day of the Month Measures = VALUES('Date'[Day Of Month])
Seriously: that’s it! I then move what were previously columns into measures with compatible names:
Compare this to the earlier implementation:
Now, our matrix behaves more as expected (note the 21st where we recorded a $4,000 exceptional charge):
This change was largely transparent, with only minor tweaks in other measures that are built off these as base measures. Ultimately this was a good reminder about data model design: it’s good to look past your immediate requirements and think of how people might want to use your model in the future. Also: calculated columns and tables have their place, but they can also be a trap, especially for those who have a long SQL background. In my example of the “Day of the Month Measures” table, it makes sense as simply the distinct list of days of the month, with the natural application of relationships in my simple model supporting proper calculation over far more types of client tool interaction (i.e. filters, grouping, etc.).
It’s become obvious in my own family that food expenses are probably the most “interesting.” (This probably doesn’t surprise you, since I do include a “Food” page in my canned Power BI report!) There are a few reasons:
- Food spending is easy to fail on. I think of the recent Wells Fargo commercial with the couple that keeps going out to eat and they eventually seek out financial advice to maybe not do that so much, to save money. Whether you really need a professional advisor to do that: I leave that as a decision for the reader, but the devil is really in the details, and I don’t see a personal advisor planning most folks’ daily meal list 😉
- Speaking of a daily meal list: I think it’s a very useful concept. It gives you a plan – and an excuse, sometimes! For example, “Sorry, we can’t go out tonight because I already took the chicken out of the freezer because it’s on the list”
- Optimizing your meals can mean planning to purchase in bulk and draw down your “shelf,” paying attention to what you should be using up. I’ve seen this result in less food waste, which is not only good for your pocketbook but the environment / land-fill!
- In theory, we should be able to generate grocery lists automagically from our meal plans.
- Planning further ahead means I’ve given myself the ability to inject more variety, revisit old favorites, and support a shift towards more of a Mediterranean diet – something that I’ve wanted to do but when thinking ahead only a few days, I can’t as easily answer “how often am I really eating according to my diet plan?” In theory this can help improve health and support weight loss goals, too.
All these benefits (and many others) are leading me towards creation of a new “meal tracking app” that will borrow analysis concepts from my Power BI reporting, but offer a way to make the day-to-day planning easier, solving problems as I encounter them in my own life (aka “testing”). (Stay tuned for an ability to participate, too!)
UPDATE: The app mentioned is available now, for free!
If you liked this article, you might also enjoy:
Did you like this article? Please rate it!